Detailed Models
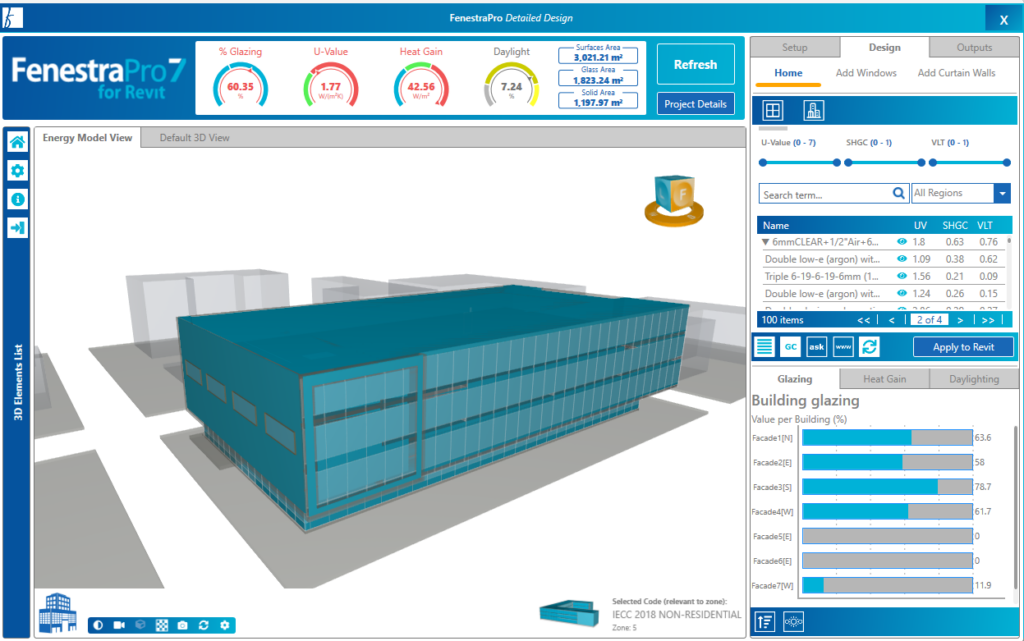
For windows, gross window openings will display (not the actual glazed area) even if no glass type has been assigned to the windows. If window frame areas are known for each family type used in the model, the total percentages may be reduced by this amount (eg. 10% frame). If some areas of a window or curtain panel are solid/non-glazed, the actual glazed area may need to be calculated separately (reduce the total percentage displayed by the solid areas and frames). The separate Thermal Analysis Tool is provided to assist with conditions like this.
For curtain walls, separate glazed and solid areas are displayed (where there may be spandrel / shadowbox panels). Glazed areas are based on transparency of the material assigned in Revit (even if no glass types have been assigned). As with all Charts, you may make selections by clicking into the bars displayed (Facades – Surfaces within – a Single Surface – reverse out to all Facades again (using the roll-up button).


