Detailed Models
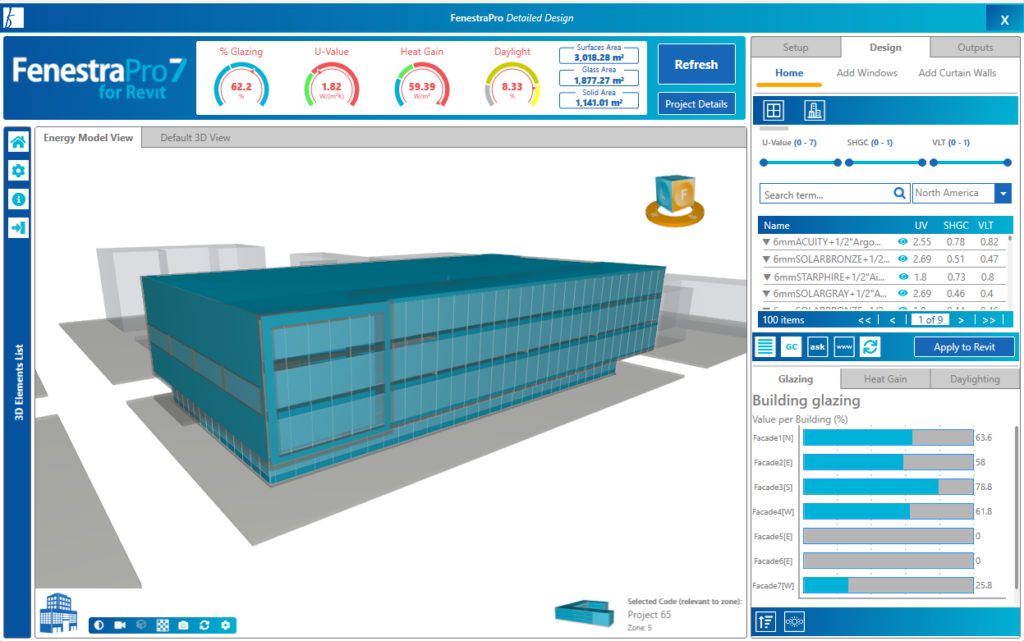
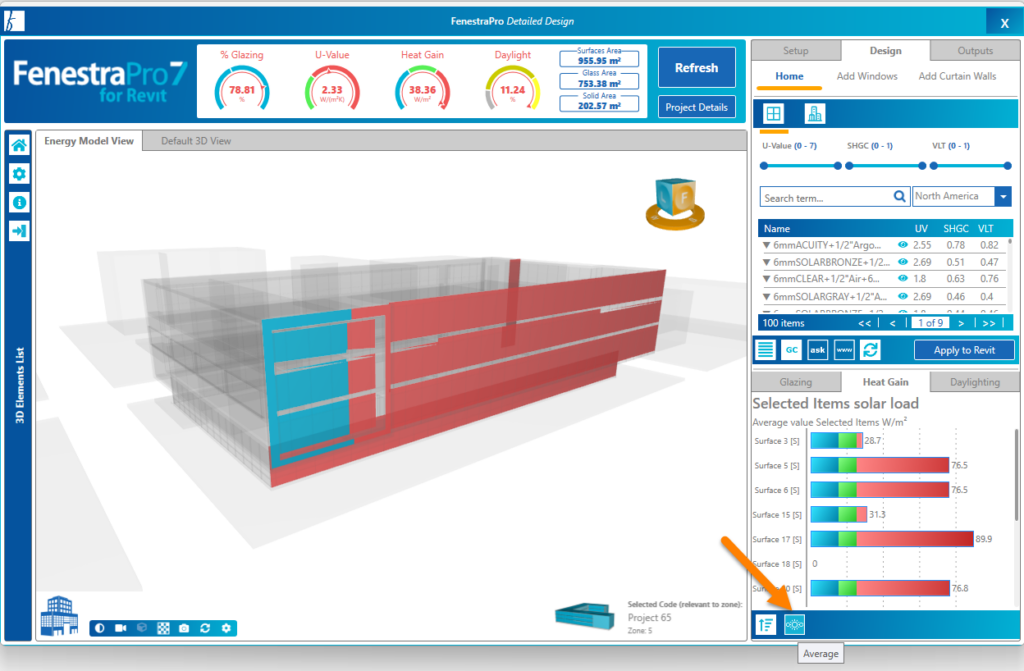
In the Detailed Tool, the Charts reside under the Glass Database. Charts display for Glazing Percentage, Heat Gain, Daylighting. Shading Percentage Charts will also display (if included in the Building Manager before calculating results).
The highlighting color on Surfaces in the Model Viewer will depend on the active Chart :
- the Glazing Chart will create blue highlights
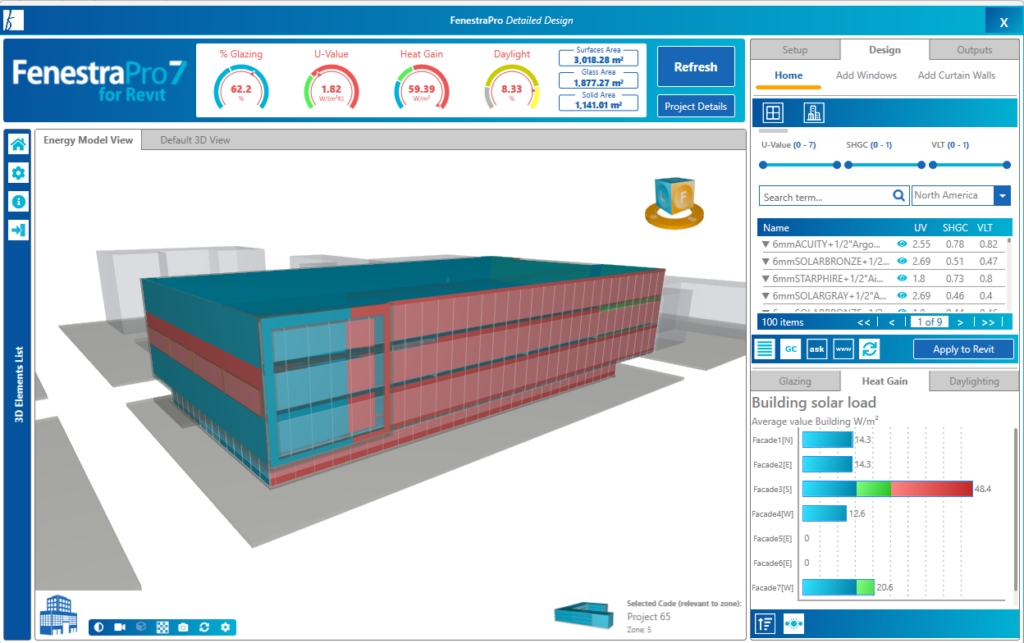
- the Heat Gain Charts will create highlights in blue/green or red
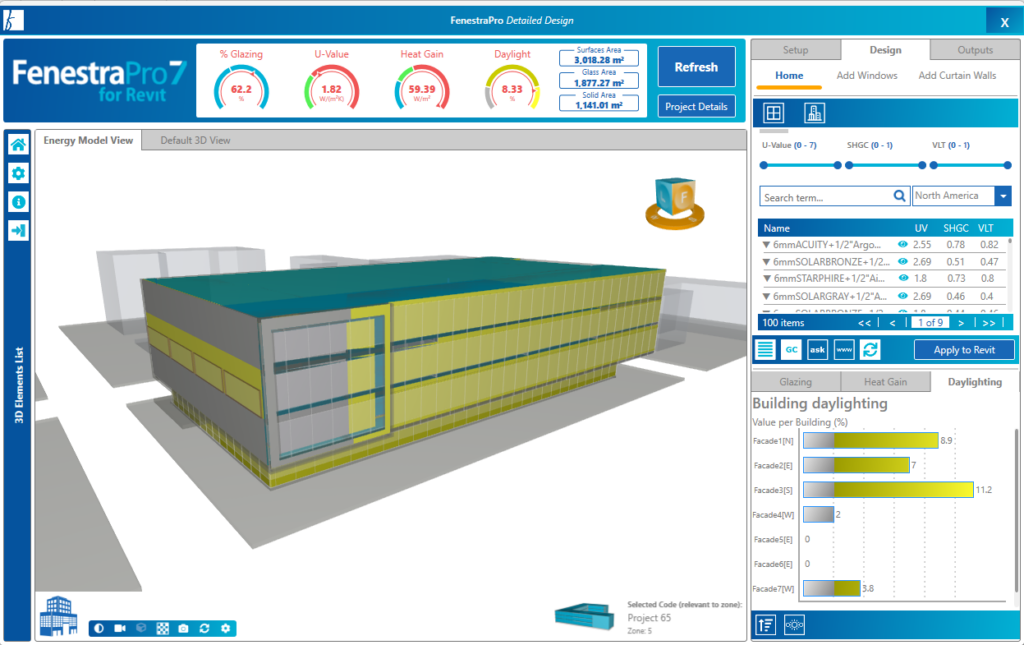
- Daylighting Charts will create highlights of yellow or grey
- Shading Charts will create grey highlights

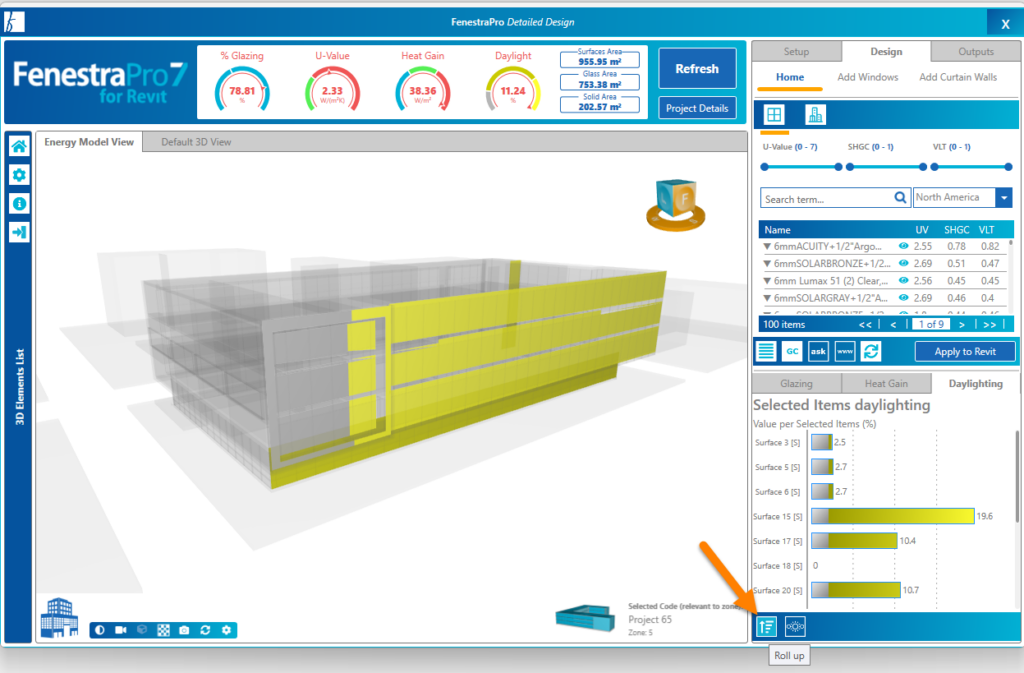
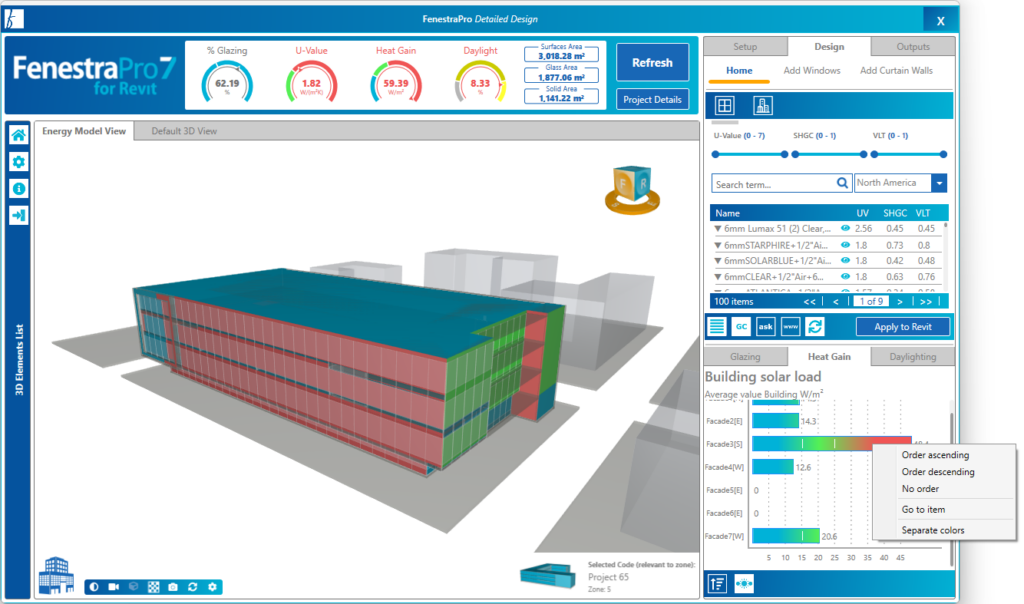
You may also make selections on the model using the Charts. You may select into a Facade and all Surfaces within this Facade are displayed. You may then select one single Surface. It is not possible to select random multiple Surfaces using the Charts (you may do this on the model itself or using the Facade Navigator). Selections and Roll Up (reversing back out) is available for all Charts. You may also select areas on the Revit model itself (external walls) and related Facades/Surfaces will get selected in the application. Selecting from the Revit model is only available for detailed models (not conceptual mass models). No matter which method is used to make selections, all methods will update to be consistent (Charts, Facades List and Model Viewer).

There are controls provide in the Charts area to toggle between Average and Peak values and to ‘roll up’ which will reverse out of selections made back to all Facades on the model.
You may also right click on the bars in the Chart and select a display style (Smooth or Separate Colors) or sort by ascending to descending values etc.
![]()
