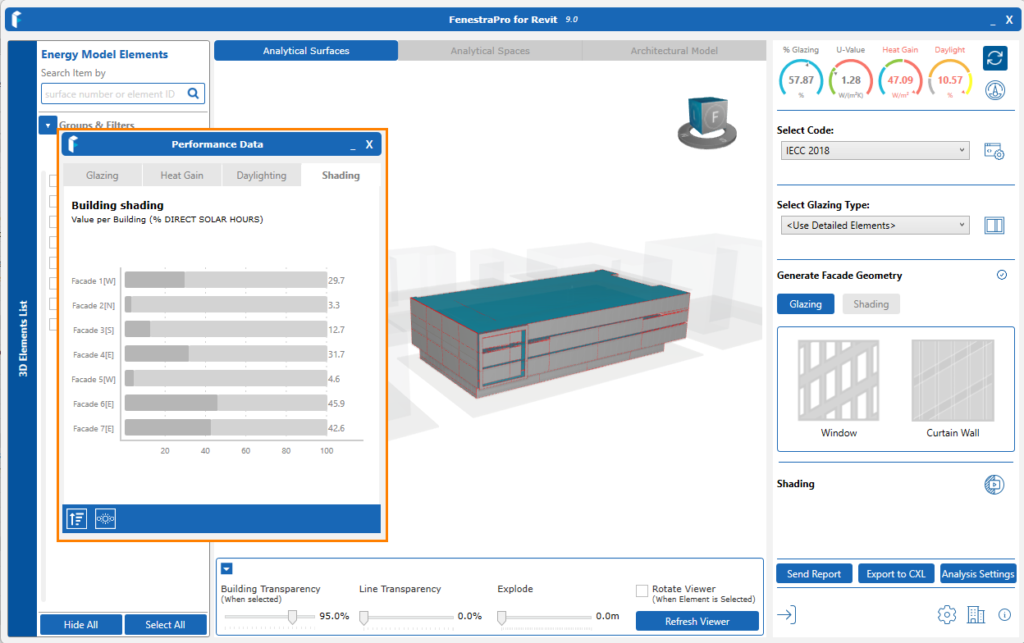
This Chart displays the percentage shading on Facades and Surfaces from surrounding objects, from self-shading and shade devices. This Chart will only be displayed if Calculate Shading Factors has been turned on. This setting can always be turned on in Analysis Settings, then recalculations done again if required. An additional Chart for Shading will then display.
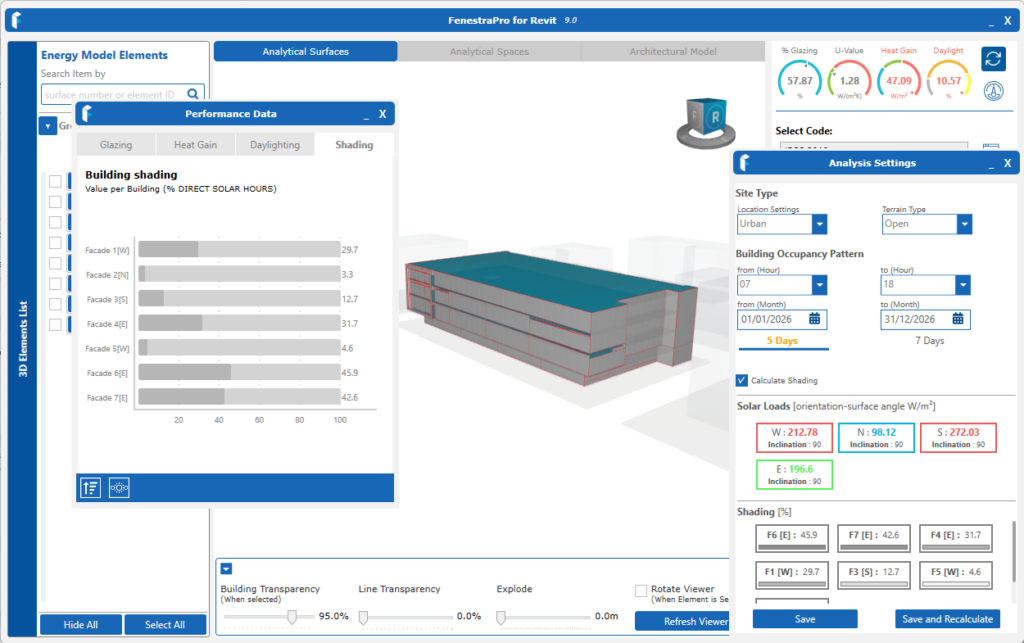
The Shading Charts display the percentage of the selected Facades/Surfaces that are shaded. Shading may be caused by surrounding buildings, self-shading on the model or shading devices (canopies or vertical fins). It does not currently provide the area of the glazed zone that is shaded.
You may navigate or make selections using the Charts as described in previous articles (using the Facades List, click on areas in the model Viewer or select areas on the Revit model itself) . From the Charts, you may select a single Facade (all Surfaces within) or a single Surface. It is not possible to select random multiple Surfaces from the Charts (this may be done from the Facade Navigator or on the model in the Viewer).