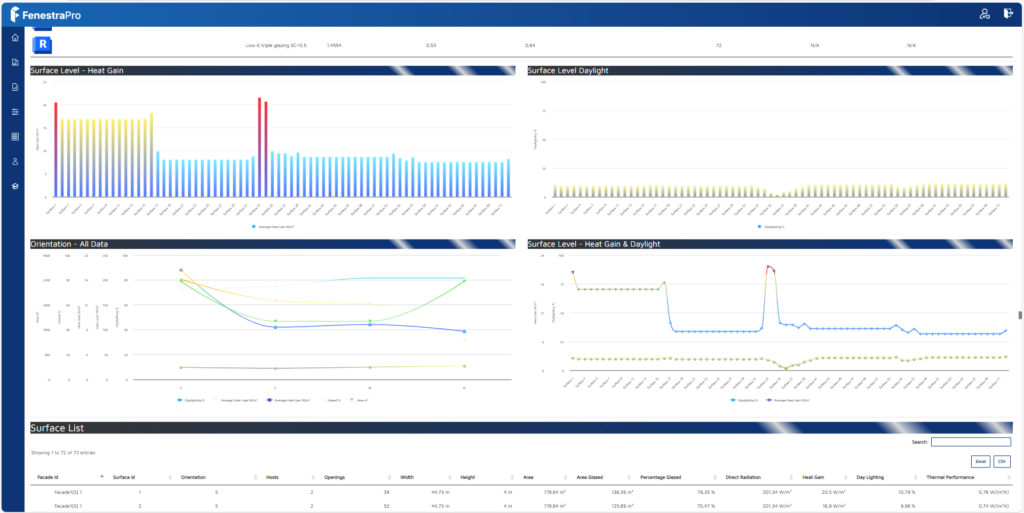
There is an option to create a HTML Report which will open in a browser window and provide more flexibility for creating custom charts. This is available for both Concept and Detailed models. Check the HTML radio button to choose this option. An online report will open in your default browser. This will allow you to view the data and create custom chart data and styles which may be downloaded and saved as PDF, JPG files etc.
Note: You will need to be signed into your online account to view HTML Reports. These are the same login credentials that you created for your online account and for using the application in Revit.
A message will indicate that the report has been transferred, you may close this message. The dialog window in Revit will remain open, this may also be closed.
Detailed Tool


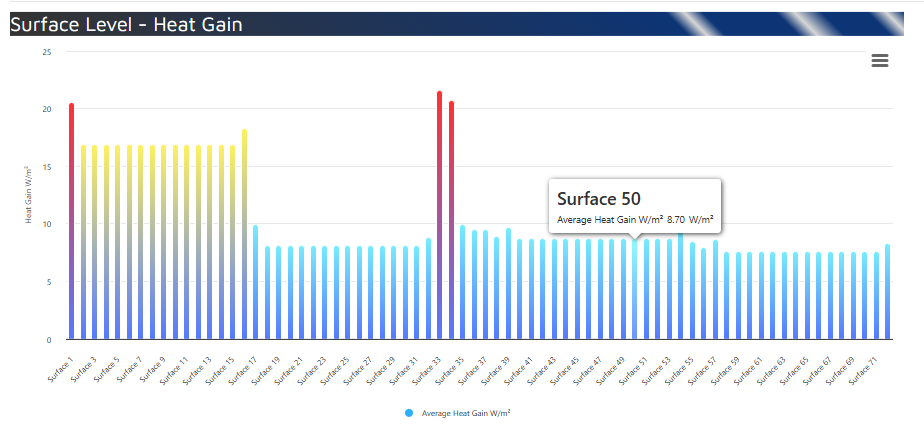
The Report will display Glass Types in the model, Surfaces and results and default charts. Hovering over areas on the Charts will display detailed information related to that Surface. Charts also have context menus where you may download various formats of the display or view in full screen.


It is also possible to create custom charts using the data in the report. This is described in the following article.

