The Glass Database also has a related Chart in your online Account area. In the main window, click on the Display as Chart option.
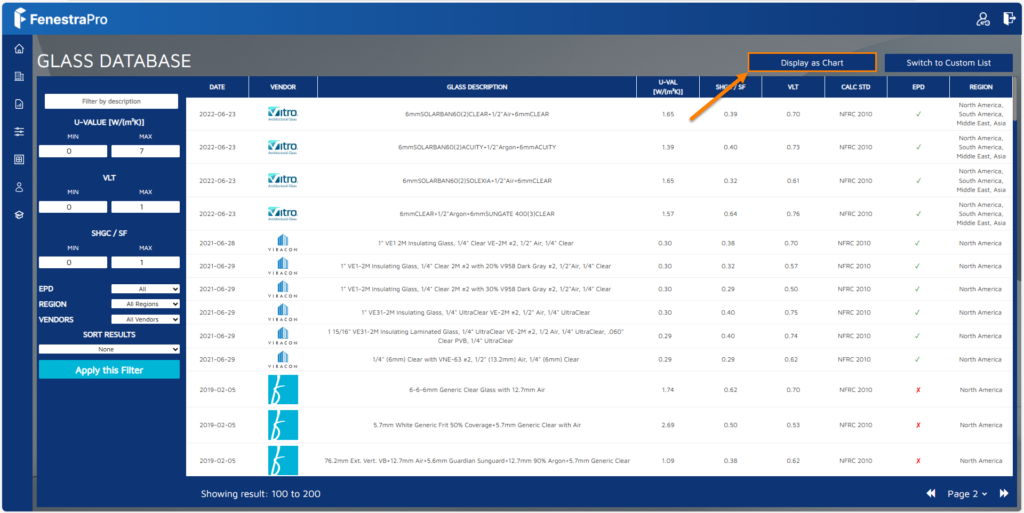
Gray dots display to represent the Glass Types in the list. Hovering over a dot will display properties for that Glass. You may need to filter by Vendor to view all glass types (as some may be obscured by others if they have the same properties).

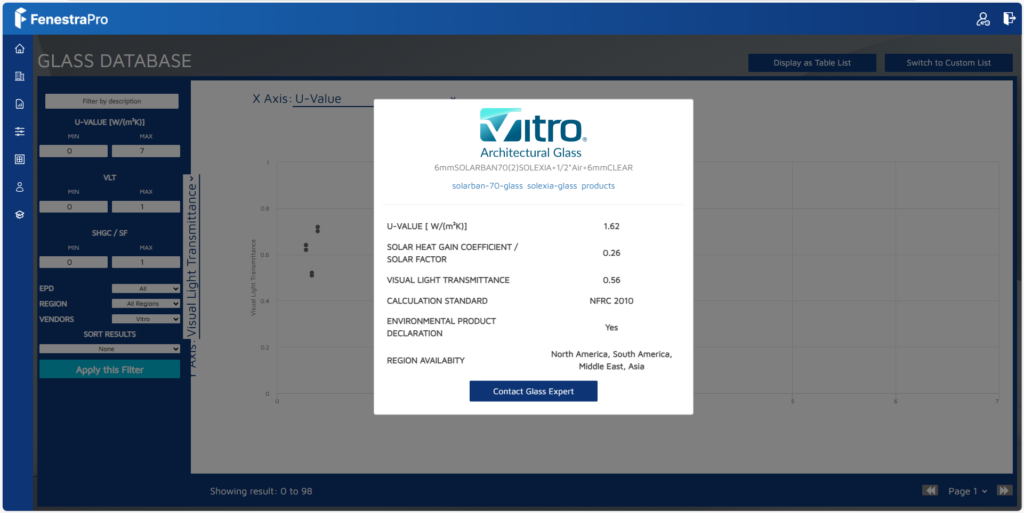
You may also click on this dot and a panel will open with the specifications.
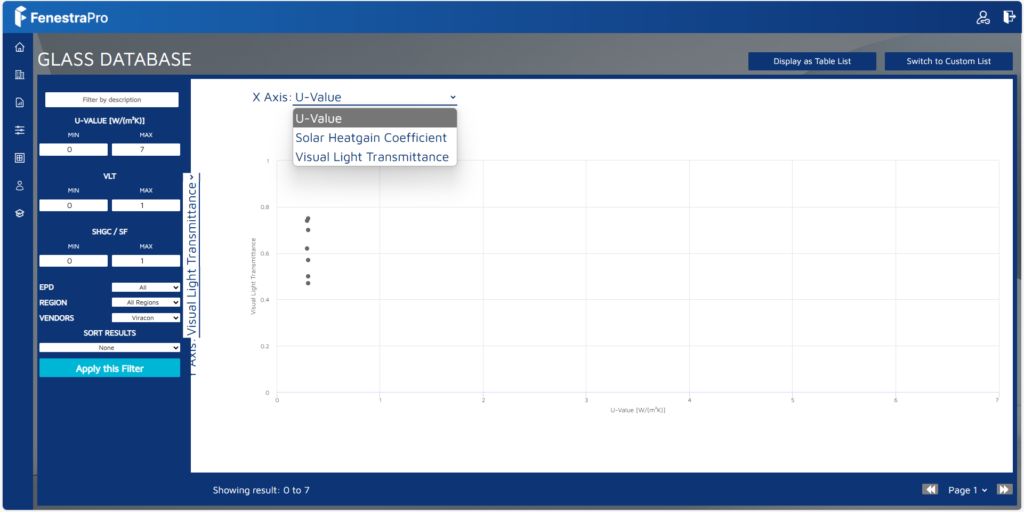
Axes may be defined by the drop-down boxes provided. You may choose from U-value, SHGC and VLT for both x and y axes.
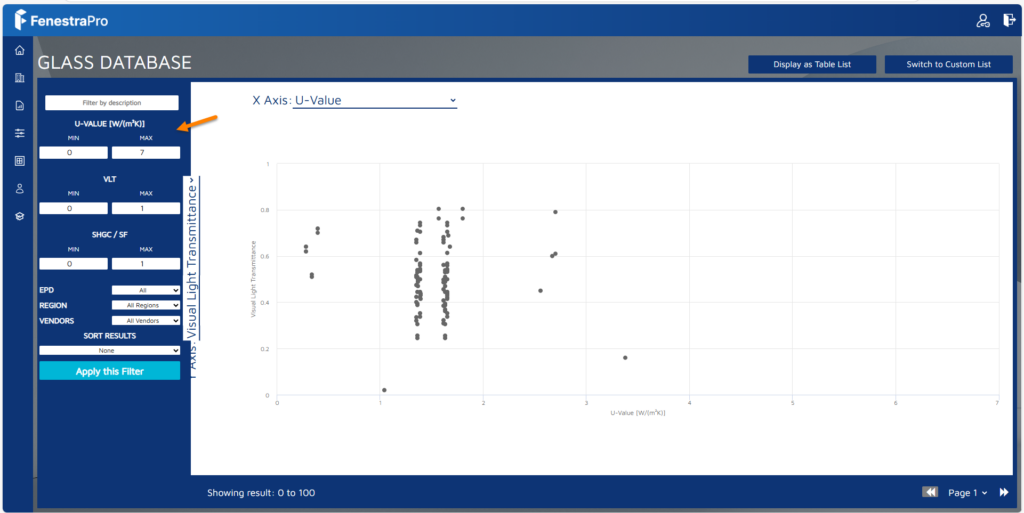
You may also filter the ranges on the left side panel for U-value, SHGC and VLT. Click on the Apply this Filter button for this to take effect. The result may also be sorted by ascending or descending values for various parameters.

If you have imported custom glass type, these may also be displayed as a Chart.
U-value = thermal properties for the glass type (how efficient it is at losing heat to the exterior (lower values are more desirable to prevent heat loss))
SHGC = Solar Heat Gain Coefficient (solar heat gain transmitted through the glass (will affect Heat Gain results))
VLT = Visual Light Transmission (light passing through the glass (will affect Daylighting results))
![]()
